
Weeks 2-3 At Metis Bootcamp - Getting Meta with Stack Exchange Predictions
We just wrapped up our second bootcamp project, presenting on Friday after two weeks of crunch time. For this project we had to generate our own datasets with web scraping, and use these datasets to build predictive regression models. The course section kicked off by covering python scraping tools (BeautifulSoup, Selenium, and Scrapy), moving toward a focus on core regression techniques as we gathered workable data. We had opportunities to practice feature selection, model assumption testing, regularization, and cross validation. Best of all, we got to choose our own websites to target and define the scope of our project. I decided to see if I could predict how many views a statistics stack exchange question would get. The stack exchange website (“Cross Validated”) is where people go to ask whatever statistics questions they might have and get insight from the broad internet community – see below for an example of an on point question from RustyStatistician!
It was an interesting challenge to pull the data I needed from SE (I ended up with 100,000+ questions worth of data). Their HTML formatting was very consistent and clean, so it wasn’t too hard to set up a scraping script to grab metadata like time asked, asker’s reputation, and the topic tags along with the question text itself. The fun part was tuning my server request rate to not upset the website and trigger request blocking. With some trial and error I was able to reach a reasonable pace that let me gradually build out the full data set without spamming the site. I’m sorry for the times I made you sad SE :(
Aside from the requirement that we work on a regression task, the project parameters were very open ended. And of course, for statistical modeling the choice of features is often even more important than the choice of model. It was clear that I should use the metadata features I had access to, but I also decided to leverage the text itself for making predictions. This was only scratching the surface of Natural Language Processing, but it was fun to extract word features and later analyze the associations between certain words and viewership levels.
I used a fairly basic method called term frequency - inverse document frequency (tf-idf), which is much simpler than it sounds. It just means that you go through each question counting how many times a certain word occurs, but then downweight that count based on how commonly the word occurs in the rest of the collection. For example, “is” occurs everywhere and shouldn’t be worth much, but “correlation” is more specific and given importance if it occurs often in a question. It’s amazing how much there is in the scikitlearn package and how easy it is to use. This code is essentially all you need to generate tf-idf feature columns –
tfidf = TfidfVectorizer(tokenizer=tokenize, min_df = 50, stop_words='english')
tfs_train = tfidf.fit_transform(X_train['text']).toarray()
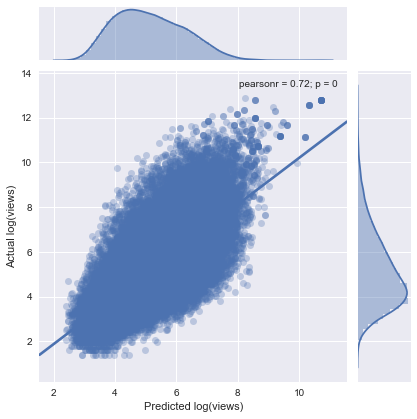
Once I had all a pipeline for extracting all my nice word features, I got to work building and cross-validating my linear model. Since I was working with many sparse features (topic tag categorical variables + tfidfs), a basic model was highly prone to instability. We’re talking an R^2 of ~.50 on the training data, but an absurd R^2 of <-90 million on the test data. This is exactly the sort of problem that regularization exists to solve, so I put the ridge regression penalty to work and tamed my unruly model coefficients. My final test R^2 was around .48, which I was very happy with given the complexity of the problem. Below is an actual vs predicted plot of my model.
Having some modest predictive accuracy was cool, but seeing the results on word feature importance was my favorite part of the project. What I found was that most of the words most strongly associated with increased viewership were related to understanding – words like “understand”, “interpret”, “explain”, “read”, and “wikipedia”. On the other hand, some of the most negative associations included “want”,”like”, and “problem”, making me think of people asking questions to get a quick fix solution to a homework problem. My takeaway from this is that if you want your SE questions to get a lot of views, you should try being kind of highbrow, intellectual, and expansive instead of being demanding and localized in your phrasing. Be like Lucille Bluth! (well, maybe not…)

As a quick reflection, I’m really happy with how my workflow panned out for this project. It was a lot of work, but I felt that I had a handle on it the entire time and didn’t try to set unreasonable expectations for what I’d be able to do (fighting off the perfectionism). When I finished a bit early, I focused on pulling together a polished presentation instead of trying to go overboard with modeling. There are definitely a bunch of things I’d want to try to build on a model like this – trying out optimized random forests, voting methods with individual models broken out by feature type, and even fancy text feature analysis like building a convNet. But that can wait for another day.
No, in my case it’s not. But I’ll get there!
If you’re interested in seeing the code for the scraper and analysis along with my slide presentation, check out this repo.